By Sara Kidd, Senior Regional Planner
This month’s map examines the age of occupied housing units in Hampton Roads by census tract. This information is collected annually by the American Community Survey (ACS) where residents are asked to identify the year their home was built. The oldest homes fall in the category of “1939 or earlier” and then are reported by each decade 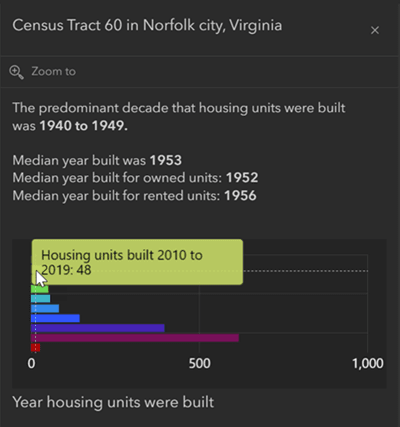 through “2020 or later.” Only occupied housing units are included in this analysis.
Housing Units Built by Decade
The map symbolizes the predominant decade that housing units were built in a census tract, based on ACS estimates. Every census tract has housing units that were built in different decades, but the map highlights the decade with the most housing units built. The distribution of the housing units built by decade can be seen by clicking on the map and viewing the interactive chart in the pop-up box.
As expected, the urban centers of Hampton Roads (Norfolk, Newport News, Hampton, Portsmouth, Suffolk, and Franklin) have the most housing units that were built before 1939. The expansion of the population into the suburbs over time is revealed in the pattern. Older suburbs closer to the urban areas have more housing units built in the 1960s and 1970s while the suburbs further away from the urban areas have more housing units built in the 1990s and later.
Median Year Built
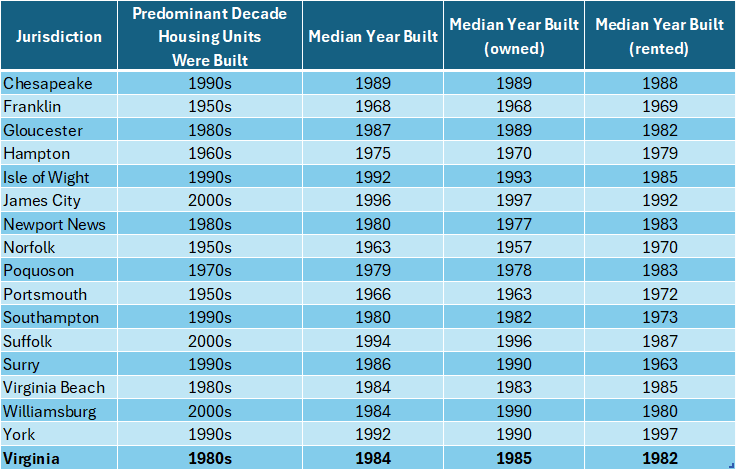
The median year built is also calculated for each census tract as there are multiple decades represented in each tract. The median year can be further broken down by whether the housing unit is owned or rented. The table below summarizes the median year built by locality, but the median year built can also be viewed by census tract in the map pop-up box. Norfolk has the oldest median year built with 1963 and James City County has the most recent median year built with 1996.
Click here to view the application in a new page.